This is the first in a series of posts I hope to write about building tools for “Peterometer”, a way to visualize stats I’ve collected about myself.
Inspiration for Peterometer
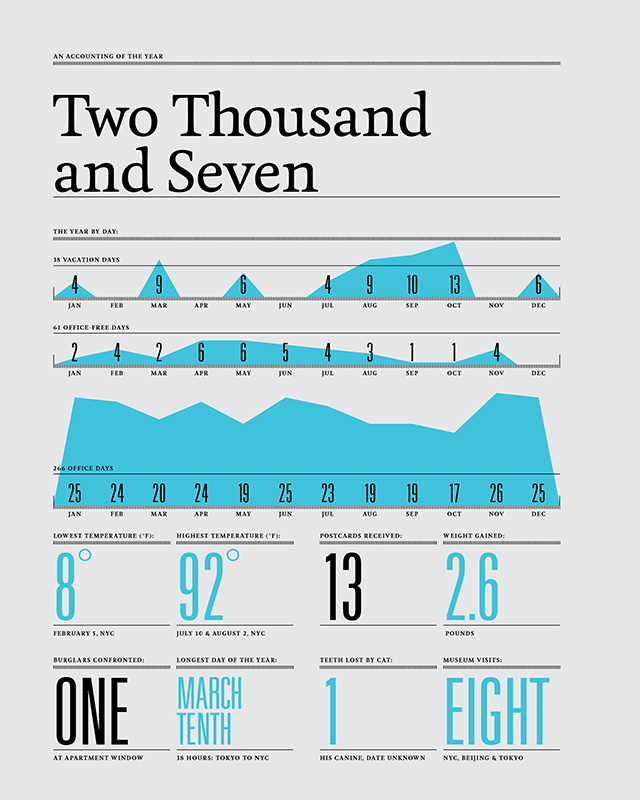
I’ve long been inspired by people who build beautiful visualizations of their gathered metrics. For example, Nicholas Felton’s annual reports. Here is an example from his 2007 report:
The first page of Nicholas Felton’s 2007 annual report
I think this format of visualization is really cool. It’s easy to glance at while being information-dense.
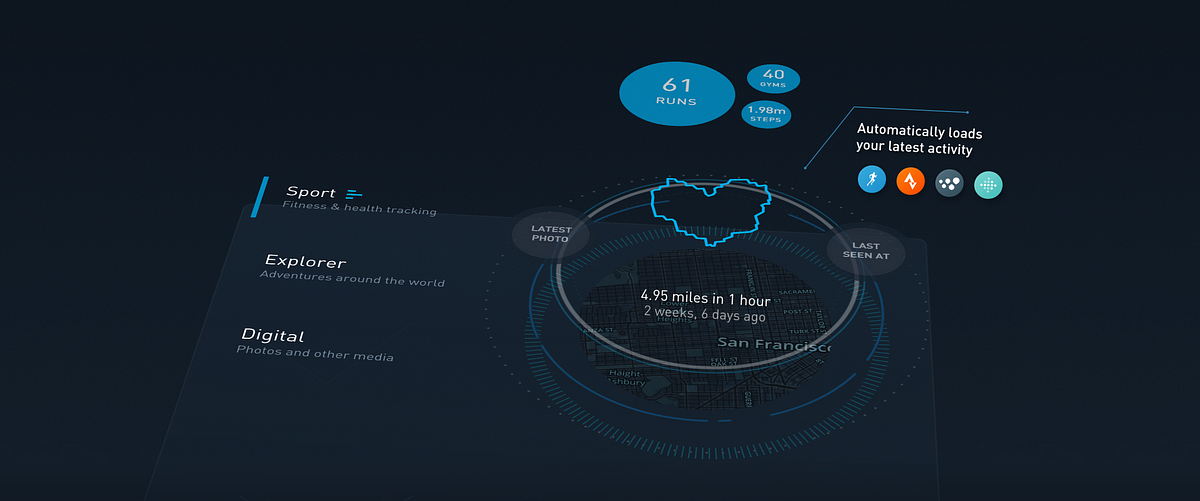
Another cool example is Anand Sharma’s April Zero, which is now an app called Gyroscope:
He has some great posts about his creative process here and here. The Iron Man-style HUD influence shines through in the finished product.
These visualizations are really cool ways to show stats gathered about your life. I’ve recently been getting more into tracking my day-to-day life, and experimenting with visualization techniques to showcase this data.
Hydration Tracking
Since December 2018, I’ve been tracking my hydration every day. Every time I finish drinking something, I log the type of drink it was, and how much of it I drank. I log the data using the WaterMinder app on my watch and phone. WaterMinder lets you have saved drinks, which is really helpful if you drink the same thing often (my Nalgene, a cup of coffee from the machine at work, etc.)
Some Visualizations
WaterMinder lets you export your data in CSV format. With a little bit of Python, we can parse this into a “stream” stacked area chart to show how I hydrate myself:
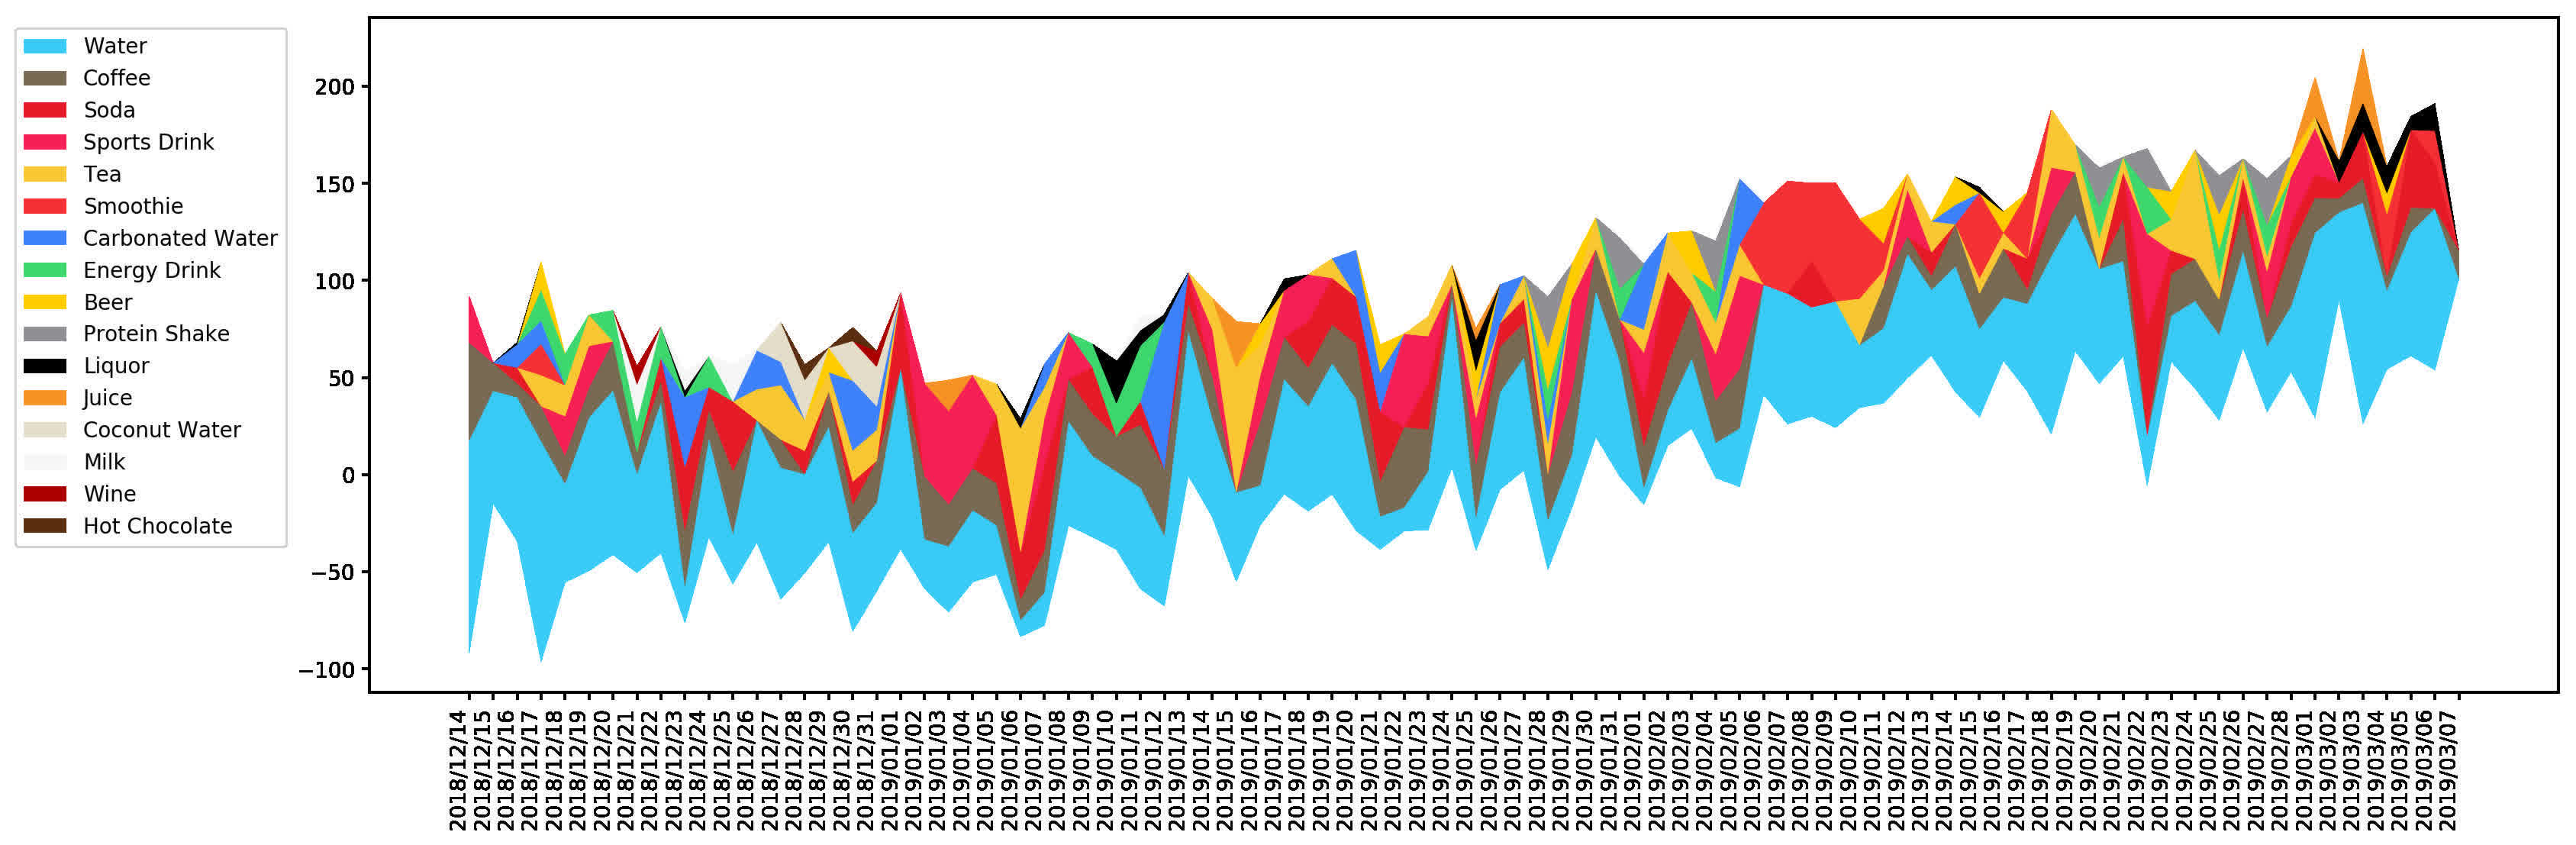
This chart is a bit tough to read due to data density. The legend is sorted in descending order of consumption. By the numbers, this is:
| Drink | fluid oz. |
|---|---|
| Water | 4159.7 |
| Coffee | 1482.7 |
| Soda | 826.9 |
| Sports Drink | 761.9 |
| Tea | 751.4 |
| Smoothie | 398.0 |
| Carbonated Water | 381.4 |
| Energy Drink | 273.6 |
| Beer | 225.0 |
| Protein Shake | 162.0 |
| Liquor | 130.0 |
| Juice | 94.0 |
| Coconut Water | 81.6 |
| Milk | 55.1 |
| Wine | 17.6 |
| Hot Chocolate | 15.0 |
| Total | 9815.9 |
Using the chart and table there are some interesting takeaways:
- I drink a lot of coffee. Almost 44 liters during this period!
- There’s coconut water consumption in late December - I had this while skiing
- In early February, there are a few days with only water, smoothies, and some soda. This corresponds to when I had my wisdom teeth removed
- I have energy drinks on the same day as protein shakes. This matches reality - I have a pre-workout energy drink and protein shake on days that I lift
- I seldom have beer, but I have more beer than I have protein shakes
- I infrequently have wine and liquor. This is good!
- You can see wine consumption during the New Years period
- Most liquor consumption was during vacations